

Political science research methods are the tools and procedures scholars use to turn political questions into evidence. If you are starting a dissertation or coursework project, your single most important next step is this: write one clear, focused research question before you touch a dataset or schedule an interview.
The three broad families of method are qualitative (interviews, case studies, documents), quantitative (surveys, statistical analysis), and mixed methods, which combine both. Your question determines which family fits, not the other way round.
Quick-start checklist:
- Write a single, focused research question (not a topic, a question)
- Check whether your university requires ethics approval before any data collection
- Identify whether UK Data Service holds relevant secondary data for your topic
- Choose your method based on what your question needs to answer
Table of Contents
- What do “research methods” mean in political science?
- How to move from a topic to a finished write-up
- Turning political ideas into measurable objects
- How research design shapes the strength of your causal claims
- Qualitative methods in practice: what to do and when
- Quantitative methods in practice: surveys, data and basic statistics
- Sampling and data collection for small projects
- Analysing your data and reporting results clearly
- Ethics, governance and UK-specific rules you need to know
- Common mistakes and how to avoid them
- Key readings and resources for UK students
- Key takeaways
- Why method anxiety is the wrong thing to worry about
- Whitebunnywabbit’s guides for student researchers
- Useful sources and where to learn more
What do “research methods” mean in political science?
Qualitative methods/07%3A_Qualitative_Methods/7.01%3A_What_are_Qualitative_Methods) use non-numerical data to explore the why behind political phenomena. Interviews, case studies, ethnography, and documentary analysis all fall here. They are well-suited to questions about meaning, process, and context: why did a particular coalition collapse? How do local councillors understand their mandate?

Quantitative methods work with numerical data to measure trends and test hypotheses. Surveys, voting records, and administrative datasets feed into descriptive statistics, cross-tabulations, and regression models. They answer questions about how many, how often, and whether X predicts Y across a large number of cases.
Mixed methods combine both, and the logic is straightforward: combining qualitative interviews with quantitative trend analysis/07%3A_Qualitative_Methods/7.01%3A_What_are_Qualitative_Methods) lets you show both why something happens and how often it does. This triangulation is especially useful when a single approach would leave either the mechanism or the scale unexplained.
Common techniques at a glance:
- Qualitative: semi-structured interviews, elite interviewing, focus groups, case studies, archival research, ethnography, content analysis
- Quantitative: surveys, observational datasets, regression (OLS and logistic), cross-tabulations, event counts
- Mixed: sequential explanatory design (quantitative first, then qualitative to explain), concurrent triangulation
As John Gerring argues, qualitative and quantitative approaches are best understood as tools for dialogue rather than competing camps. Method choice should follow your research aims.
Pro Tip: Pick the method that best answers your question, not the one you feel most comfortable with. Comfort is a poor guide to validity.
How to move from a topic to a finished write-up
A clear sequence prevents the most common student failure: starting data collection before the question is properly formed. The steps below apply to a dissertation or substantial coursework project.
- Narrow your topic. A topic is not a question. “Brexit” is a topic; “Did Leave-voting constituencies show higher rates of political disengagement in the 2019 general election?” is a question. Spend time here.
- Formulate your research question and hypotheses. A good question is specific, answerable with available data, and genuinely open (you do not already know the answer). State at least one hypothesis: a testable prediction about the relationship you expect to find.
- Conduct a literature review. Map what is already known, identify the gap your project addresses, and note which methods previous studies used. Two to three weeks is realistic for a term-long project.
- Choose your research design. Decide on qualitative, quantitative, or mixed methods. Identify your units of analysis (individuals, parties, countries) and your data sources.
- Submit your ethics application. Do this before any data collection. Universities have formal protocols for data storage, informed consent, and anonymisation/09%3A_Research_Ethics/9.01%3A_Ethics_in_Political_Research) that can delay your project if you leave them until the last moment.
- Collect data. Run your pilot first (see Section 8). Adjust your instruments based on what the pilot reveals.
- Analyse and write up. Clean your data, run your analysis, and write results and discussion together rather than as separate stages.
Deliverables to track:
- Week 1–2: draft research question and initial bibliography
- Week 3–4: literature review outline and ethics application submitted
- Week 5–6: data collection (after approval)
- Week 7–8: analysis and first draft of results
Successful research requires clearly defined concepts, variables, and hypotheses at the outset to avoid anecdotal conclusions. Expect to revisit your question after the pilot: that is not a failure, it is the process working.
Turning political ideas into measurable objects
Conceptualisation is the process of defining what you mean by a political concept. Operationalisation is the process of deciding how to measure it. Students often conflate the two, which produces indicators that do not actually capture the concept they care about.
A simple example: “political trust” is a concept. Operationalised, it might become four survey items asking respondents how much they trust Parliament, local government, the civil service, and political parties, scored on a five-point scale. The concept and the measure are not the same thing; the measure is your best practical approximation.
Key terms to know:
- Independent variable: the factor you think causes or predicts an outcome
- Dependent variable: the outcome you are trying to explain
- Control variable: a factor you hold constant to isolate the relationship of interest
- Unit of analysis: the entity you are making claims about (individual voter, constituency, party, country)
Measurement pitfalls:
- Validity: does your measure actually capture the concept? A single question about voting intention does not measure political engagement.
- Reliability: does the measure produce consistent results across time and coders? Inconsistent coding rules destroy reliability.
- Ecological fallacy: drawing conclusions about individuals from aggregate data (e.g. assuming that because a constituency voted Leave, every resident there did).
Operationalisation mistakes are among the most common in student projects. A short codebook and an explicit decision log help reproducibility and make supervision discussions far more productive. Build both from day one.
A bad operationalisation example: using newspaper coverage volume as a proxy for “political salience” without accounting for editorial bias. A better one: using a validated salience index from a comparative manifesto project, with explicit coding rules documented in an appendix.
How research design shapes the strength of your causal claims
Not all research designs give you the same confidence that X causes Y. Understanding the hierarchy matters because it shapes what claims you can honestly make in your write-up.
Design types and their causal leverage:
- Experimental designs (random assignment to treatment and control) offer the strongest causal inference. True experiments are rare in political science outside of survey experiments and field experiments.
- Quasi-experimental designs (regression discontinuity, difference-in-differences, instrumental variables) exploit natural variation to approximate experimental conditions. They are more feasible but require strong assumptions.
- Observational designs are the most common in student projects. They describe and correlate but cannot rule out confounding without careful controls.
Common threats to causal inference:
- Confounding: a third variable causes both X and Y, creating a spurious correlation
- Selection bias: the cases you observe are not representative of the population you want to generalise to
- Reverse causality: Y might actually cause X, not the other way round
Practical strategies for students:
- Use process tracing in case studies to trace the causal mechanism step by step
- Apply controlled comparison: select cases that are similar on key background variables but differ on the independent variable
- Be explicit about what your design cannot establish; examiners reward honesty about limitations
A concrete illustration: a study comparing voter turnout in two constituencies before and after a boundary change uses a quasi-experimental logic. The boundary change is an external shock that affects one group but not another, giving you leverage on the causal question without random assignment.
Pro Tip: State your design’s limitations in your methods section, not buried in a footnote. Examiners read for self-awareness, and it is a mark of methodological maturity.
Qualitative methods in practice: what to do and when
Students commonly find the logistical intricacies of designing and analysing qualitative projects more challenging than the conceptual side. The guidance below is practical rather than theoretical.
-
Case study design. Select cases purposively: a typical case tests whether a theory holds under expected conditions; a deviant case tests why it does not. Document your selection rationale explicitly. Single-case studies are legitimate for theory-building; comparative case studies (two to four cases) allow controlled comparison.
-
Elite and semi-structured interviewing. Identify interviewees through purposive or snowball sampling. Draft an interview guide with open-ended questions grouped by theme, but treat it as a prompt rather than a script. Pilot the guide with a colleague before your first real interview. Record with consent, transcribe, and store securely.
-
Focus groups. Useful for exploring shared meanings and group dynamics rather than individual attitudes. Recruit six to eight participants per group. Facilitate rather than lead: your job is to prompt discussion, not steer it.
-
Archival and documentary research. Define your document corpus before you start searching. Parliamentary debates (Hansard), government white papers, party manifestos, and Freedom of Information responses are all accessible in the UK. Note the provenance of each document: who produced it, for what audience, and when.
-
Ethnography. Sustained observation of a political setting (a campaign office, a council chamber, a protest). Requires the most time and the most careful ethical planning. Field notes should be written up the same day.
Coding qualitative data:
- Develop a codebook: a list of codes, their definitions, and example passages
- Apply codes systematically across all transcripts or documents
- Run intercoder reliability checks if you have a second coder (even a peer)
- Use NVivo or Atlas.ti for larger datasets; a well-organised spreadsheet works for smaller ones
When is qualitative the right call? When your question asks how or why, when your population of cases is small, or when you need to trace a process rather than measure a distribution.
Quantitative methods in practice: surveys, data and basic statistics
Quantitative analysis in politics starts with a clear match between your research question and your data source. Surveys capture attitudes and self-reported behaviour; administrative datasets (electoral returns, parliamentary votes, public spending figures) capture actual behaviour and outputs.
Core statistical tools:
- Descriptive statistics: means, medians, frequencies, and standard deviations. Always start here before running any model.
- Cross-tabulations: compare distributions across groups (e.g. vote choice by age group). Useful for categorical variables.
- Correlation: measures the strength and direction of a linear relationship between two continuous variables. Does not imply causation.
- OLS regression: estimates the relationship between a continuous dependent variable and one or more independent variables, holding controls constant.
- Logistic regression: used when the dependent variable is binary (voted/did not vote, supported/opposed a policy).
Software options:
- R (free, open-source): steep learning curve but the most flexible option; widely used in academic political science
- Stata: common in UK social science departments; excellent documentation but requires a licence
- SPSS: point-and-click interface makes it accessible for beginners; available through most UK university IT services
- jamovi (free): a user-friendly front end for R, suitable for introductory coursework
Pro Tip: Report your regression coefficients with confidence intervals, not just p-values. A coefficient that is statistically significant but substantively tiny tells your reader very little.
Practical notes: for a student survey, aim for at least 100 responses for simple bivariate analysis; more if you plan to include multiple controls. Power is a real constraint, and being honest about it in your methods section is better than overclaiming from a thin sample.
Sampling and data collection for small projects
Sampling logic is simple in principle: you want your cases or respondents to represent the population you are making claims about. In practice, student projects almost always face constraints of time, access, and budget.
- Secondary data sidesteps sampling entirely. The UK Data Service holds thousands of datasets, including the British Election Study, the British Social Attitudes survey, and the Understanding Society longitudinal study. Access is free for registered UK academics and students.
- Estimating sample size: — for a simple survey with a 50/50 split on a binary question, a margin of error of ±10 percentage points requires roughly 100 responses; ±5 points requires roughly 400. These are rough guides, not substitutes for a power calculation.
Pro Tip: Register with the UK Data Service at the start of your project, not when you need the data. Access requests and institutional registration can take several days.
Analysing your data and reporting results clearly
The first pass through your data should be exploratory, not confirmatory. Before running any model, spend time understanding what you have.
- Clean your data. Check for missing values, outliers, and coding errors. Document every decision you make during cleaning in a separate log.
- Visualise. Histograms, scatter plots, and bar charts reveal patterns that summary statistics hide. In R, ggplot2 produces publication-quality figures with modest effort.
- Run descriptive statistics. Report means, standard deviations, and frequencies for all key variables before presenting any inferential results.
- Test relationships. Start with bivariate analysis (cross-tabs, correlation) before moving to multivariate models. If the bivariate relationship is not there, a regression is unlikely to rescue it.
- Interpret coefficients plainly. “A one-unit increase in political interest is associated with a 0.3-point increase in turnout intention, holding age and education constant” is more useful than “the coefficient is significant at p < 0.05.”
Reporting qualitative findings:
- Use direct evidence extracts (quotes, document passages) to support each analytical claim
- Organise findings thematically, not chronologically
- Be transparent about negative cases: evidence that does not fit your argument is as important as evidence that does
- Cite your data sources using the UK Data Service citation format where applicable
Reproducibility basics:
- Save your R or Stata code as a script, not just the output
- Include a data appendix or supplementary file with your codebook
- Cite datasets formally: the UK Data Service provides persistent identifiers (DOIs) for all its holdings
Ethics, governance and UK-specific rules you need to know
Ethics should be integrated into research design from the outset/09%3A_Research_Ethics/9.01%3A_Ethics_in_Political_Research), not treated as a procedural box to tick at the end. A study that collects data without proper consent is not just ethically problematic; it may be unusable.
Core ethical obligations:
- Informed consent: participants must understand what they are agreeing to, how their data will be used, and that they can withdraw at any time
- Anonymisation: remove or pseudonymise identifying information before analysis and storage; do not store names alongside sensitive responses
- Power imbalances: be especially careful when interviewing people in positions of vulnerability or when your institutional affiliation creates implicit pressure to participate
- Data minimisation: collect only the data you actually need for your research question
UK practicalities:
- All UK universities have a research ethics committee (sometimes called an Institutional Review Board or IRB equivalent). Submit your application before any data collection. Even low-risk projects can take two to four weeks to clear.
- Under UK GDPR (the UK’s post-Brexit adaptation of the EU General Data Protection Regulation), personal data must be stored securely, retained only as long as necessary, and not transferred outside the UK without appropriate safeguards. Your university’s data protection officer can advise on specifics.
- If you are using secondary data from the UK Data Service or UK Data Archive, check the end-user licence for each dataset. Some datasets have restricted access and require additional registration.
Ethics is not a bureaucratic hurdle. It is the foundation of trustworthy research. A study that cuts corners on consent or anonymisation cannot be defended in a viva, published in a journal, or cited by others. Build your ethics plan on day one.
Pre-data-collection ethics checklist:
- Ethics application submitted and approved
- Participant information sheet and consent form drafted
- Data storage plan agreed with your supervisor (encrypted drive, university server)
- GDPR compliance confirmed with your institution’s data protection officer
- Dataset end-user licences checked (for secondary data)
For further context on journalism ethics breaches and how ethical failures damage credibility, Whitebunnywabbit’s UK-focused guide illustrates why these principles matter beyond academia.
Common mistakes and how to avoid them
| Do | Don’t |
|---|---|
| Write a focused, answerable research question first | Start with a broad topic and hope a question emerges |
| Submit your ethics application in week one or two | Leave ethics approval until data collection is imminent |
| Pilot your survey or interview guide | Deploy instruments without testing them |
| Document operationalisation decisions in a codebook | Assume your indicators obviously capture your concepts |
| Be explicit about design limitations in your methods section | Overclaim causal inference from observational data |
| Use secondary data (UK Data Service) where it fits | Collect primary data when suitable secondary data already exists |
| Iterate: revisit your question after the pilot | Treat your initial question as fixed regardless of what the pilot reveals |
In practice, aligning theory and methodology is iterative; initial scope often needs narrowing when data realities emerge. That is not a sign of poor planning. It is how good research actually works.
Pro Tip: Keep a research log: a running document where you record decisions, dead ends, and changes of direction. It is invaluable for writing your methods section and for supervision meetings.
Three time-management realities for a term-long project:
- Ethics approval and data access permissions together can consume three to four weeks. Build that into your Gantt chart from day one.
- Literature reviews almost always take longer than students expect. Allocate at least two weeks and do not cut this short to start data collection earlier.
- Analysis and write-up are not sequential. Start drafting your methods section while you are still collecting data.
Key readings and resources for UK students
The resources below are the ones worth consulting first. Each serves a different purpose.
Textbooks:
- Introduction to Political Science Research Methods (Open Textbook Library, CC BY-NC): covers the scientific method, measurement, research design, qualitative and quantitative methods, and ethics. Free to download. The best starting point for students on a budget or those who want a comprehensive overview before buying anything.
- Research Methods for Political Science (Taylor & Francis / CQ Press): a standard course text that integrates quantitative and qualitative tools, covering questionnaire design, logistic regression, and text analysis. Widely assigned on UK undergraduate programmes.
- Qualitative Research in Politics and International Relations (SAGE): particularly strong on the practical challenges of fieldwork, coding, and case selection. Recommended for students whose projects are primarily qualitative.
- Empirical Political Analysis (Routledge): covers both quantitative and qualitative approaches with worked examples. Useful as a companion text alongside a methods module.
UK module guidance:
- King’s College London Research Methods in Political Science: the KCL module page outlines learning outcomes, suggested readings, and the scope of topics covered. Useful as a benchmark for what a well-structured methods module covers, even if you are not a KCL student.
UK data and repositories:
- UK Data Service: the primary gateway for UK social science datasets. Holds the British Election Study, British Social Attitudes, and hundreds of other datasets. Free for registered UK students and academics.
- UK Data Archive (part of the UK Data Service): the physical and digital repository underlying the service. Provides guidance on data management, citation, and end-user licences.
The Open Textbook Library edition of Introduction to Political Science Research Methods is licensed under Creative Commons (CC BY-NC), which means you can download, read, and share it freely for non-commercial educational purposes. Cite it as you would any academic text.
For a broader sense of how political research intersects with media and public discourse, Whitebunnywabbit’s explainer on partisan media and opinion formation illustrates how observational study design and confounding play out in real-world political analysis.
Key takeaways
Choosing the right method for your research question, planning ethics early, and piloting your instruments are the three decisions that most reliably separate strong student projects from weak ones.
| Point | Details |
|---|---|
| Match method to question | Choose qualitative, quantitative, or mixed methods based on what your question needs, not personal preference. |
| Plan ethics from day one | Submit your university ethics application before any data collection; approval can take two to four weeks. |
| Pilot before full deployment | Test surveys and interview guides with five to ten people first; adjust based on what you find. |
| Use secondary data where possible | The UK Data Service offers free access to major UK datasets including the British Election Study. |
| Whitebunnywabbit for context | Whitebunnywabbit’s political explainers and ethics guides support student researchers with real-world examples and UK-focused commentary. |
Why method anxiety is the wrong thing to worry about
The students who struggle most with research methods are usually not the ones who lack statistical knowledge or qualitative skill. They are the ones who spend weeks agonising over which method to use instead of just starting. Method anxiety is real, but it is almost always a displacement activity.
Here is the thing: your first research question will probably be too broad. Your first interview guide will have at least two questions that do not work. Your first attempt at coding will produce categories that overlap. None of that is a problem. It is the process. The researchers who produce good work are not the ones who got it right first time; they are the ones who piloted early, iterated quickly, and kept a record of what they changed and why.
One concrete habit worth adopting immediately: open a research log on day one. A simple document where you record your decisions, your doubts, and your changes of direction. It will feel unnecessary at first. By the time you are writing your methods section, it will be indispensable.
The other thing students underestimate is how much the ethics and data-access stage shapes everything downstream. Book your ethics meeting in the first week of your project. Not because the committee will be difficult, but because the process of completing the application forces you to think through your design in a level of detail that no amount of reading about methods will achieve.
Whitebunnywabbit’s guides for student researchers
Political research does not happen in a vacuum. Understanding how data is collected, how media frames political events, and how ethical failures distort public knowledge are all part of becoming a sharper researcher. Whitebunnywabbit publishes plain-language explainers on exactly these questions: how media bias develops and what it means for evaluating political research, how political misinformation spreads, and what responsible reporting looks like in practice.
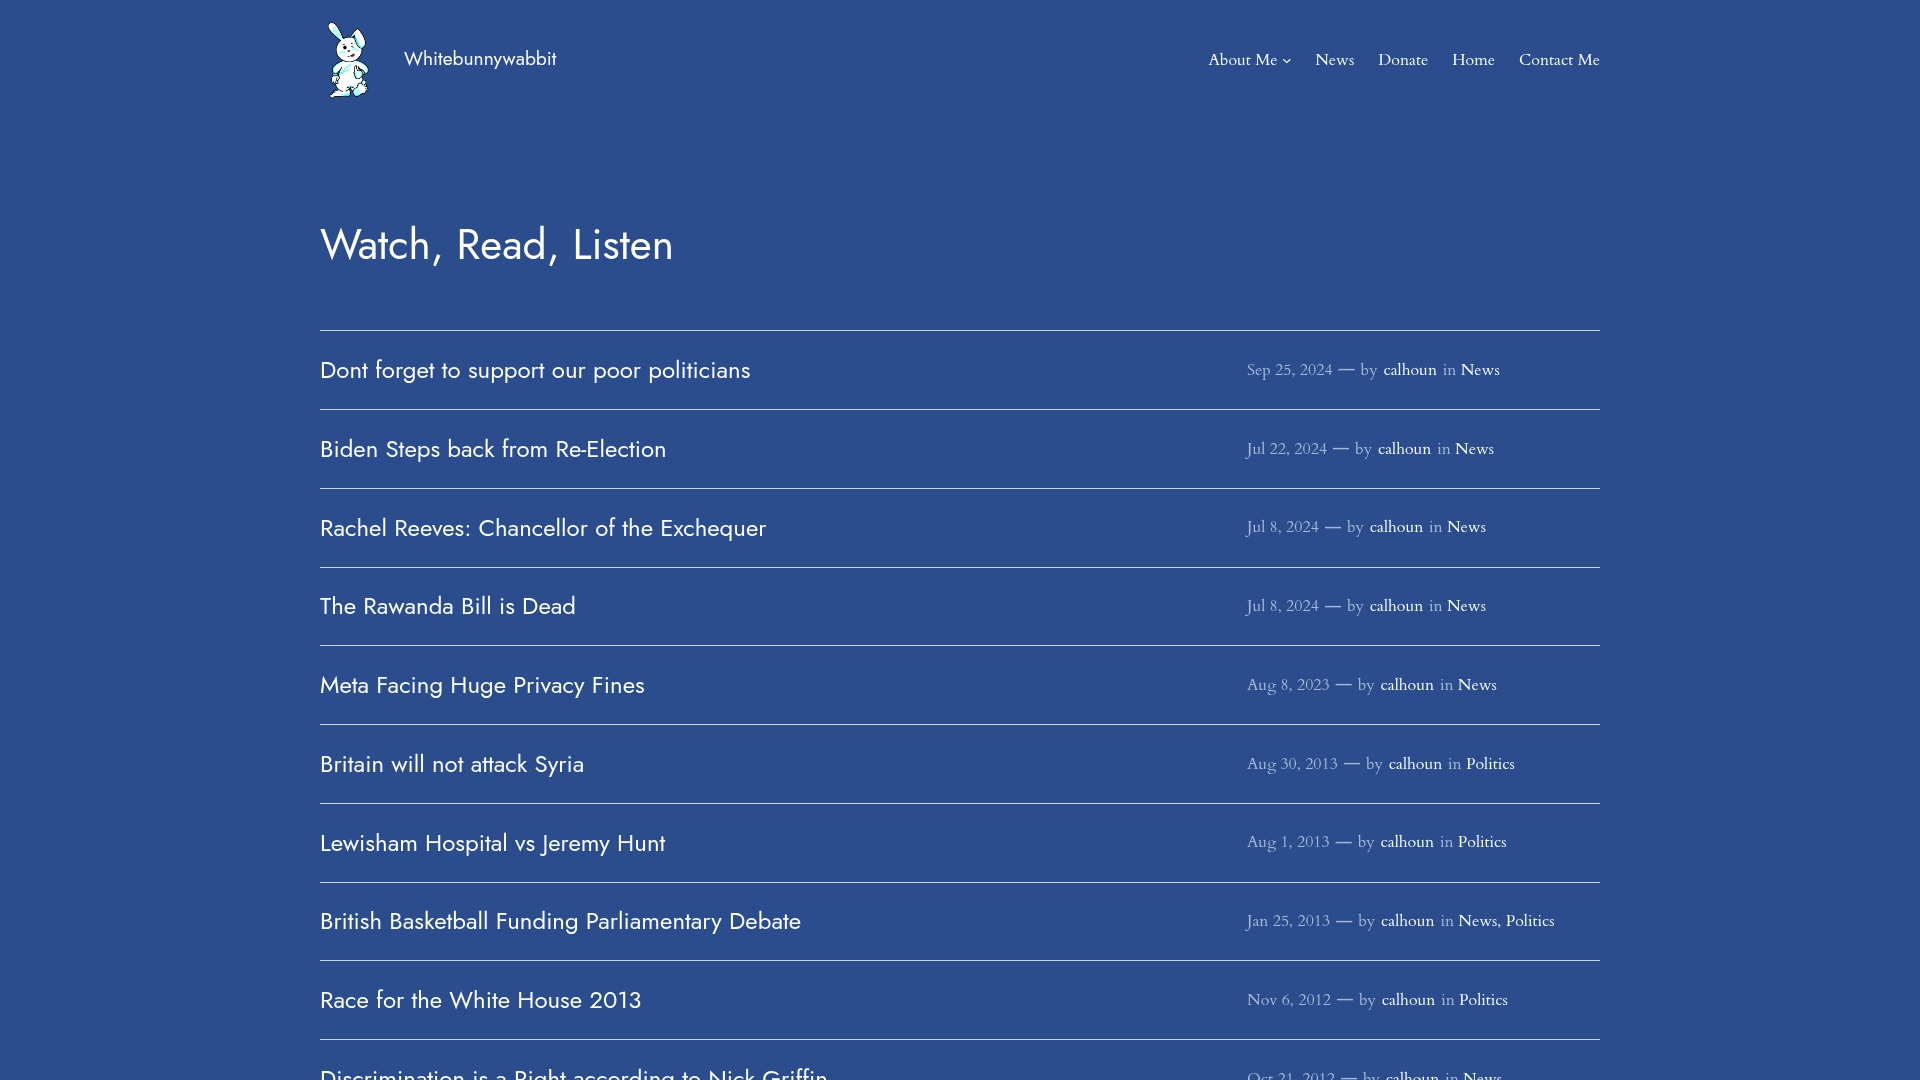
For students working on projects that touch on data, journalism, or the information environment, the site’s piece on the future of data is a useful companion to the technical methods guidance above. It covers data trends and their implications for research and public knowledge in accessible, non-technical terms. Read it alongside your methods textbook, not instead of it. Then come back to Whitebunnywabbit when you want to see how the concepts you are studying play out in the real world of political commentary and media analysis.
Useful sources and where to learn more
- UK Data Service: the primary source for UK social science datasets; best for accessing secondary data including the British Election Study and British Social Attitudes survey. Free for registered UK students.
- UK Data Archive: the underlying repository; consult its guidance pages for data management plans, citation formats, and end-user licence requirements.
- Open Textbook Library: Introduction to Political Science Research Methods: the best free OER for introductory methods coverage; licensed CC BY-NC, so you can download and cite it freely for educational use.
- King’s College London Research Methods in Political Science module: useful as a benchmark for module-level learning outcomes and suggested readings.
- Annual Review of Political Science: John Gerring on method choice: a short, authoritative read on why method choice should follow research aims rather than disciplinary fashion.
When citing OER materials such as the Open Textbook Library edition, use the standard academic citation format for your institution (APA, Harvard, or Chicago) and include the Creative Commons licence in your bibliography entry.
Leave a Reply